> For the complete documentation index, see [llms.txt](https://polinema.gitbook.io/jti-modul-praktikum-pembelajaran-mesin/llms.txt). Markdown versions of documentation pages are available by appending `.md` to page URLs; this page is available as [Markdown](https://polinema.gitbook.io/jti-modul-praktikum-pembelajaran-mesin/job-sheet-7-clustering/praktikum-2.md).
# Praktikum 2
Konsep K-Means untuk klasterisasi data
import library
```python
import matplotlib.pyplot as plt
import seaborn as sns; sns.set()
import numpy as np
```
### Pengantar k-Means
```python
from sklearn.datasets import make_blobs
X, y_true = make_blobs(n_samples=300, centers=4,
cluster_std=0.60, random_state=0)
plt.scatter(X[:, 0], X[:, 1], s=50);
```
Nanti akan muncul tampilan seperti di bawah ini:
```python
from sklearn.cluster import KMeans
kmeans = KMeans(n_clusters=4)
kmeans.fit(X)
y_kmeans = kmeans.predict(X)
```
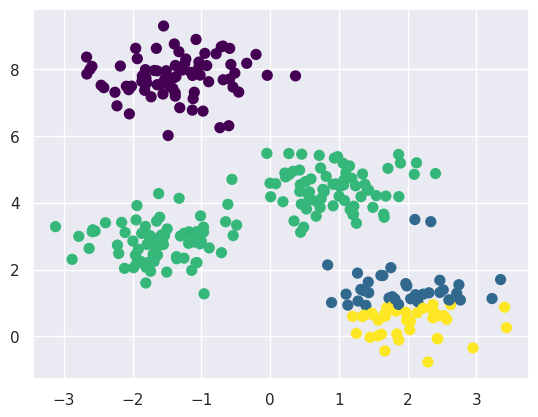
```python
plt.scatter(X[:, 0], X[:, 1], c=y_kmeans, s=50, cmap='viridis')
centers = kmeans.cluster_centers_
plt.scatter(centers[:, 0], centers[:, 1], c='black', s=200, alpha=0.5)
```
Nanti akan muncul tampilan seperti di bawah ini:
### Algoritma Expectation-Maximization
```python
from sklearn.metrics import pairwise_distances_argmin
def find_clusters(X, n_clusters, rseed=2):
# 1. Randomly choose clusters
rng = np.random.RandomState(rseed)
i = rng.permutation(X.shape[0])[:n_clusters]
centers = X[i]
while True:
# 2a. input label center yang baru
labels = pairwise_distances_argmin(X, centers)
# 2b. update center dari titik baru
new_centers = np.array([X[labels == i].mean(0)
for i in range(n_clusters)])
# 2c. cek konvergensi
if np.all(centers == new_centers):
break
centers = new_centers
return centers, labels
centers, labels = find_clusters(X, 4)
plt.scatter(X[:, 0], X[:, 1], c=labels,s=50, cmap='viridis');
```
Nanti akan muncul tampilan seperti di bawah ini:
#### Perubahan random
```python
centers, labels = find_clusters(X, 4, rseed=0)
plt.scatter(X[:, 0], X[:, 1], c=labels,s=50, cmap='viridis');
```
Nanti akan muncul tampilan seperti di bawah ini:
#### Optimalisasi Jumlah Klaster
```python
labels = KMeans(6, random_state=0).fit_predict(X)
plt.scatter(X[:, 0], X[:, 1], c=labels, s=50, cmap='viridis');
```
Nanti akan muncul tampilan seperti di bawah ini:
#### Batas Klaster yang Tidak Selalu Linier
```python
from sklearn.datasets import make_moons
X, y = make_moons(200, noise=.05, random_state=0)
```
```python
labels = KMeans(2, random_state=0).fit_predict(X)
plt.scatter(X[:, 0], X[:, 1], c=labels,s=50, cmap='viridis');
```
Nanti akan muncul tampilan seperti di bawah ini:
```python
from sklearn.cluster import SpectralClustering
model = SpectralClustering(n_clusters=2, affinity='nearest_neighbors',
assign_labels='kmeans')
labels = model.fit_predict(X)
plt.scatter(X[:, 0], X[:, 1], c=labels, s=50, cmap='viridis');
```
Nanti akan muncul tampilan seperti di bawah ini:
### Contoh Kasus 1: Karakter Angka
```python
from sklearn.datasets import load_digits
digits = load_digits()
digits.data.shape
```
```
(1797, 64)
```
```python
# terapkan K-Means
kmeans = KMeans(n_clusters=10, random_state=0)
clusters = kmeans.fit_predict(digits.data)
kmeans.cluster_centers_.shape
```
```
/usr/local/lib/python3.10/dist-packages/sklearn/cluster/_kmeans.py:870: FutureWarning: The default value of `n_init` will change from 10 to 'auto' in 1.4. Set the value of `n_init` explicitly to suppress the warning
warnings.warn(
(10, 64)
```
```python
fig, ax = plt.subplots(2, 5, figsize=(8, 3))
centers = kmeans.cluster_centers_.reshape(10, 8, 8)
for axi, center in zip(ax.flat, centers):
axi.set(xticks=[], yticks=[])
axi.imshow(center, interpolation='nearest', cmap=plt.cm.binary)
```
Nanti akan muncul tampilan seperti di bawah ini:
```python
from scipy.stats import mode
labels = np.zeros_like(clusters)
for i in range(10):
mask = (clusters == i)
labels[mask] = mode(digits.target[mask])[0]
```
```python
from sklearn.metrics import accuracy_score
accuracy_score(digits.target, labels)
```
```
0.7935447968836951
```
```python
from sklearn.metrics import confusion_matrix
mat = confusion_matrix(digits.target, labels)
sns.heatmap(mat.T, square=True, annot=True, fmt='d', cbar=False,
xticklabels=digits.target_names,
yticklabels=digits.target_names)
plt.xlabel('true label')
plt.ylabel('predicted label');
```
Nanti akan muncul tampilan seperti di bawah ini:
```python
from sklearn.manifold import TSNE
tsne = TSNE(n_components=2, init='random', random_state=0)
digits_proj = tsne.fit_transform(digits.data)
# hitung klaster
kmeans = KMeans(n_clusters=10, random_state=0)
clusters = kmeans.fit_predict(digits_proj)
# permutasi label
labels = np.zeros_like(clusters)
for i in range(10):
mask = (clusters == i)
labels[mask] = mode(digits.target[mask])[0]
# hitung akurasi
accuracy_score(digits.target, labels)
```
```
/usr/local/lib/python3.10/dist-packages/sklearn/cluster/_kmeans.py:870: FutureWarning: The default value of `n_init` will change from 10 to 'auto' in 1.4. Set the value of `n_init` explicitly to suppress the warning
warnings.warn(
0.9415692821368948
```
### Studi Kasus 2: Kompresi Citra
```python
from sklearn.datasets import load_sample_image
flower = load_sample_image("flower.jpg")
ax = plt.axes(xticks=[], yticks=[])
ax.imshow(flower);
```
Nanti akan muncul tampilan seperti di bawah ini:
```python
flower.shape
```
```
(427, 640, 3)
```
```python
data = flower / 255.0
data = data.reshape(427 * 640, 3)
data.shape
```
```
(273280, 3)
```
```python
def plot_pixels(data, title, colors=None, N=10000):
if colors is None:
colors = data
# choose a random subset
rng = np.random.RandomState(0)
i = rng.permutation(data.shape[0])[:N]
colors = colors[i]
R, G, B = data[i].T
fig, ax = plt.subplots(1, 2, figsize=(16, 6))
ax[0].scatter(R, G, color=colors, marker='.')
ax[0].set(xlabel='Red', ylabel='Green', xlim=(0, 1), ylim=(0, 1))
ax[1].scatter(R, B, color=colors, marker='.')
ax[1].set(xlabel='Red', ylabel='Blue', xlim=(0, 1), ylim=(0, 1))
fig.suptitle(title, size=20);
```
```python
plot_pixels(data, title='Input color space: 16 million possible colors')
```
Nanti akan muncul tampilan seperti di bawah ini:
```python
import warnings; warnings.simplefilter('ignore') # Fix NumPy issues.
from sklearn.cluster import MiniBatchKMeans
kmeans = MiniBatchKMeans(16)
kmeans.fit(data)
new_colors = kmeans.cluster_centers_[kmeans.predict(data)]
plot_pixels(data, colors=new_colors,title="Reduced color space: 16 colors")
```
Nanti akan muncul tampilan seperti di bawah ini:
```python
flower_recolored = new_colors.reshape(flower.shape)
fig, ax = plt.subplots(1, 2, figsize=(16, 6),
subplot_kw=dict(xticks=[], yticks=[]))
fig.subplots_adjust(wspace=0.05)
ax[0].imshow(flower)
ax[0].set_title('Original Image', size=16)
ax[1].imshow(flower_recolored)
ax[1].set_title('16-color Image', size=16);
```
Nanti akan muncul tampilan seperti di bawah ini: